The Graphing Tool Report Definition editor is used to define the name of the report, the devices and values to be contained in the report and the selected chart definition to use for all devices and values within the report.
Report Name
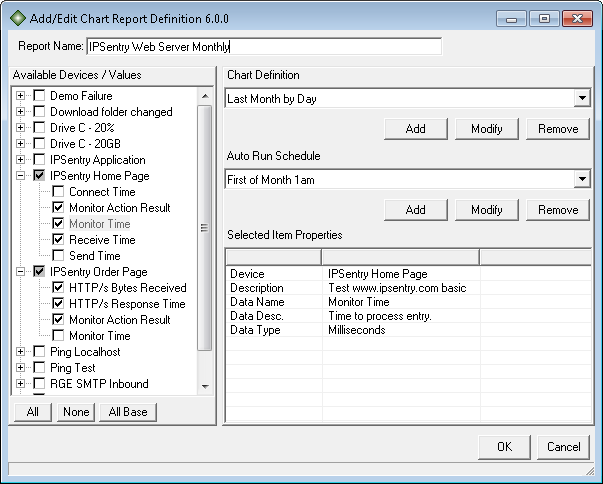
Provide a descriptive report name for this definition. This name will be used in the main reports Table of Contents as well as in the header display for the reports, charts, and detail items.Auto Run Schedule
Provide a descriptive auto-run schedule for this report. When the graphing tool is first run, the schedule named "Manual Only" will be created. Select the "Manual Only" schedule to disable auto-run of the selected report.
Add
Click the Add button to add a new chart schedule definition. You will be presented with the Chart Schedule Editor.Modify
Click the Modify button to edit the selected chart schedule definition. You will be presented with the Chart Schedule Editor.Remove
Click the Remove button to delete the selected chart schedule definition.Available Devices / Values
This area displays a list of devices and values that are associated with the device from which you may select to output to the report.
To select or de-select all values for a specific device, simply right-click on the device to enable/disable all values.
To select or de-select specific values, you perform the same right-lick on the value to select or deselect the value.
You can select ALL devices and ALL variables by clicking the "ALL" button.
You can de-select ALL devices and ALL variables by clicking the "NONE" button.
You can select the base entries (Action Status & Action Time) for all devices by clicking the "All Base" button.Chart Definition
The chart definition devices the reporting period, sample interval, graph inclusion, detail inclusion, and quality information for this report. Either select a configured chart definition from the list, or you may Add a new chart, Modify or Remove an existing chart.
If you remove a chart definition that is in use by another report, well - there just isn't going to be a chart available, so use the remove option with great care. It's better to add a new one or modify the current chart. Use the remove option ONLY if you know it is not required.Add
Click the Add button to add a new chart definition to be used by your various reports. You will be presented with the Chart Definition Editor.Modify
Click the Modify button to modify the currently selected chart definition. You will be presented with the Chart Definition EditorRemove
Click the Remove button to delete the currently selected chart definition. Again, this action can not be undone and any report using this chart definition will no longer have a chart definition available.Selected Item Properties
This area displays information about the Device or Value selected in the Available Devices/Values listing such as it's description and data type.
When you remove a device from ipSentry, the data associated with that device will still be available within the graphing tool and eventually be purged based on your data retention selection. If you add a new device with the same exact name, you will see multiple entries with the same name since the devices are tracked by their unique identifier and not by their name.
In areas such as the SNMP add-in, if you change the assigned name of an assigned variable or in the Temperature add-in, if you change the probe information, this will generate a new variable as the value may or may not be associated to the same location. When changing variable identifiers within ipSentry, they must be selected within the ipSentry Graphing Tool since the old values will no longer exist.